

Your CPU temperature is the clearest early-warning signal your computer gives you. Every processor has a built-in digital thermal sensor, and reading it takes less than two minutes with free software with no need to open the case or touch any hardware.
Regularly checking your CPU temperature helps keep your computer running smoothly and reduces the risk of overheating or hardware damage. On Windows, download a free tool like Core Temp or HWiNFO to see live per-core temperature readings. On a Mac, use built-in tools or a lightweight app like iStat Menus. In either case, a CPU idling between 30–50°C is healthy, while sustained temperatures above 90°C under load are a sign something may need attention.
This guide walks through every reliable method to check CPU temperature, on Windows, in macOS, and directly in your BIOS/UEFI firmware, what temperatures are normal, and how to fix a CPU that’s running too hot.
Key Takeaways
- Laptops run hotter than desktops by design due to space constraints; a temperature that would concern a desktop user is often normal for a laptop.
- A normal CPU temperature is roughly 30–50°C at idle and 65–85°C under sustained gaming or heavy load; sustained readings above 90°C warrant attention.
- Every CPU has a specific TjMax (maximum safe temperature) that varies by model, check your exact chip’s rating rather than assuming one number applies universally.
- BIOS/UEFI only shows idle temperature, since the OS and applications haven’t loaded, it’s a baseline check, not a load-testing method.
How to Check CPU Temperature on Windows
Windows doesn’t display CPU temperature anywhere in its native interface, so you’ll need a small monitoring tool. All the options below are free, install in under a minute, and read temperature data straight from your processor’s internal sensors, the same sensors your motherboard uses to control fan speed.
Three tools cover almost every use case: Core Temp for a fast, no-fuss reading; HWiNFO for detailed, ongoing monitoring; and HWMonitor as a reliable, simple alternative that also tracks other hardware sensors.
1. Monitor CPU Temperature with Core Temp
Core Temp is the fastest way to check your CPU temperature on Windows. It’s lightweight, free, and built specifically to do one job well: show you what each CPU core is running at, right now.
How to check CPU temperature with Core Temp:
- Download Core Temp from its official site and run the installer.
- During setup, decline any bundled offers as Core Temp itself is fully free without them.
- Launch the program. You’ll immediately see your CPU model, along with a live temperature reading for every physical core.
- Note the Tj. Max value shown in the interface. It is your specific CPU’s maximum safe operating temperature, and every other reading should be judged against it.
- To see how hot your CPU gets under real use, leave Core Temp running in the background while you game, render, or multitask, then check the Max column afterward.
Core Temp updates in real time and can also show a temperature reading directly in your system tray, so you can glance at it without opening the app.
2. Monitor CPU Temperature with HWiNFO
If you want more than a quick glance; historical logging, sensor-by-sensor detail, or data to diagnose an intermittent crash, HWiNFO is the tool most enthusiasts and power users reach for.
How to check CPU temperature with HWiNFO:
- Download HWiNFO and, when prompted during launch, choose Sensors-only mode. This skips the full system summary and takes you straight to live sensor data.
- Scroll to your CPU’s section, usually labelled with your exact processor name (for example, an Intel Core or AMD Ryzen model).
- Look for the following key readings:
- CPU Package: The single most useful figure; an overall temperature reading for the whole chip.
- Core #0, #1, #2…: Individual core temperatures, useful for spotting one core running unusually hot.
- Tdie / Tctl: on AMD Ryzen systems specifically, you may see both; Tdie is the more accurate real die temperature, while Tctl includes a small offset used internally for fan-curve control.
- Right-click any value and select Reset Min/Max before a gaming or benchmarking session, so your Max reading reflects only that session.
- HWiNFO logs this data over time, which makes it the better choice if you’re trying to diagnose a crash that happened an hour or a day ago rather than checking temperature at the moment.
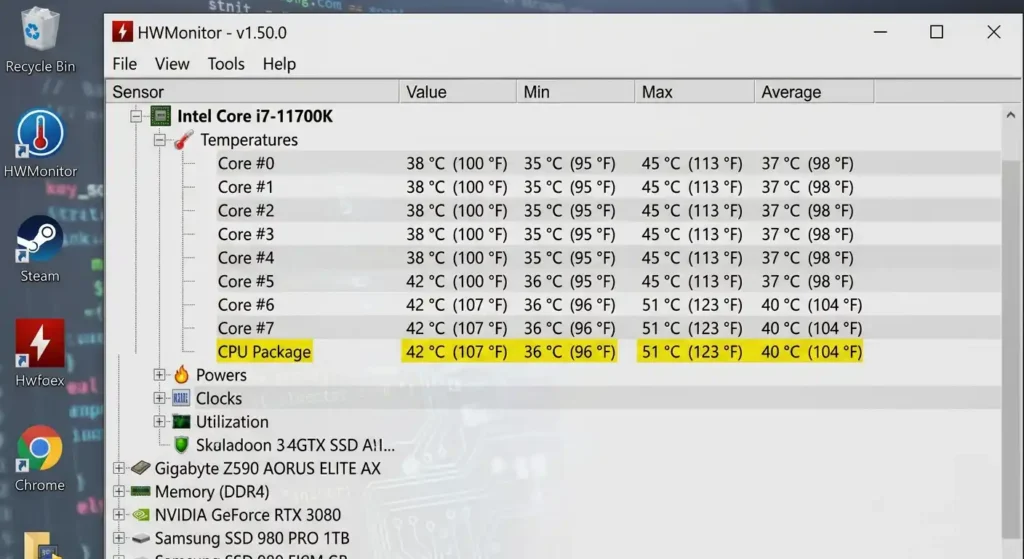
3. Monitor CPU Temperature with HWMonitor
HWMonitor, made by CPUID (the team behind CPU-Z), offers a simpler layout than HWiNFO while still reading every major sensor on your motherboard and CPU. It gives a full picture of the temperatures, voltages, and fan speeds of the entire system.
How to check CPU temperature with HWMonitor:
- Download and install HWMonitor from CPUID’s official site.
- Open the program and expand the section matching your CPU model.
- Look for Temperatures, then check the Value, Min, and Max columns for the Package reading and each core.
- Leave it running during normal use if you want to track how temperatures shift between idle and load without switching tools mid-session.
HWMonitor is a solid middle ground: less granular than HWiNFO, but with a cleaner interface than juggling multiple sensor categories.
4. Can Task Manager Show CPU Temperature?
No, Windows Task Manager cannot show CPU temperature. Task Manager displays CPU usage percentage, clock speed, and process-level resource consumption, but it has no built-in access to thermal sensor data in Windows 10 or Windows 11. If you’ve opened the Performance tab looking for a temperature reading, I know you haven’t found one because it simply isn’t there, and no update has added it. Task manager is good for quick checks but not for in-depth monitoring or troubleshooting, so you’ll need one of the third-party tools above; there’s no way around installing something extra for this specific reading.
How to Monitor CPU Temperature in macOS
Apple doesn’t include a built-in temperature display in macOS either, so Mac users are in a similar position to Windows users, a small utility does the job.
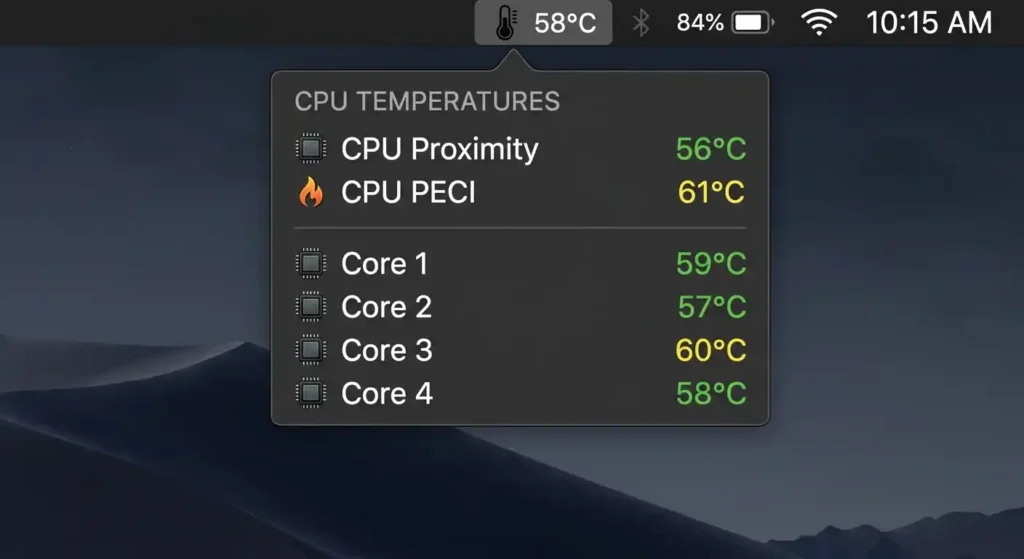
- iStat Menus is the most complete option: a paid menu-bar app that shows live CPU temperature, per-core load, fan speed, and other system sensors at a glance, updating continuously without needing to open a separate window.
- Intel Power Gadget works on Intel-based Macs and reads power and thermal data directly from the processor, making it a solid free option for older Intel Macs specifically.
- MenuMeters is a lightweight, open-source menu-bar utility for a simpler system-monitoring view, including thermal information on supported models.
- Macs Fan Control pairs temperature monitoring with the ability to manually adjust fan curves, useful if your Mac is running hot and loud and you want more aggressive cooling than Apple’s default profile provides.
On Apple Silicon Macs (M-series chips), thermal behavior differs somewhat from Intel Macs, these chips are engineered to run cooler under typical workloads and throttle earlier and more efficiently than running hot for extended periods. Third-party temperature utilities are less commonly used on M-series machines, though they’re still useful for diagnosing sustained heavy loads like video export or compiling code.
How to Check CPU Temperature in BIOS/UEFI
Every modern motherboard includes a hardware monitor inside its BIOS or UEFI firmware, and this is the one method that works even if Windows won’t boot.
Steps to check CPU temperature in BIOS/UEFI:
- Restart your computer.
- As it boots, repeatedly press the key shown on your startup screen; commonly Delete, F2, F10, or F12, depending on your motherboard manufacturer.
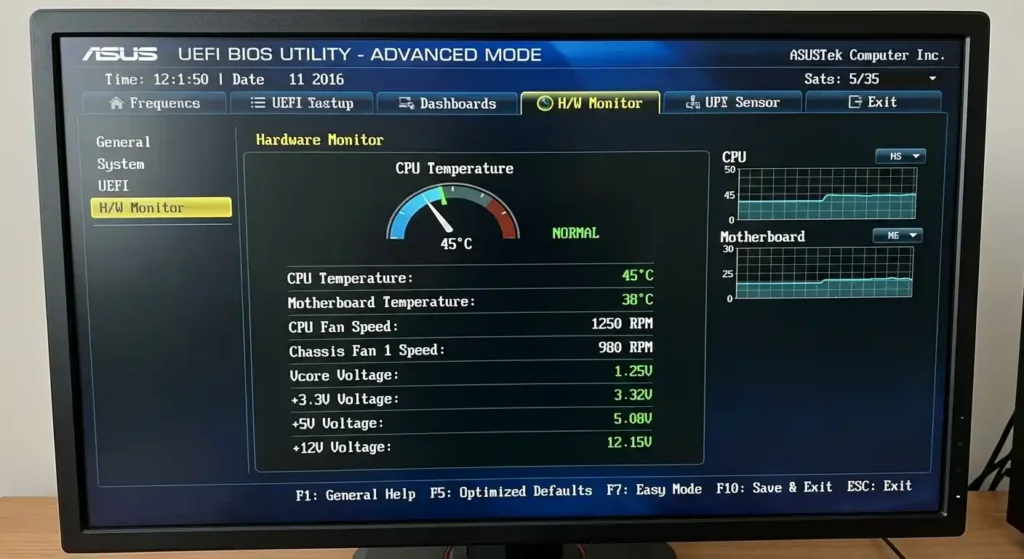
- Once inside the BIOS/UEFI setup, look for a section named Hardware Monitor, PC Health Status, or H/W Monitor (naming varies by manufacturer, but the location is almost always similar).
- Your CPU temperature will be listed alongside fan speeds and voltage readings.
Important limitation: BIOS/UEFI temperature readings represent a light-load or near-idle state and aren’t useful for measuring temperatures during normal workloads such as gaming or rendering. This makes it useful for a baseline health check or troubleshooting a system that won’t boot into the operating system. For measuring temps during normal workloads, you need third party tools, running while Windows (or macOS) is active and the CPU is under actual load. As you have to restart your PC, it’s not practical for regular monitoring under load.
Stress Testing
Stress testing is a technique used for checking the performance as well as the cooling of a CPU when it is operating at its maximum capacity. It is especially helpful if your target is to make sure that the system will remain stable under heavy and demanding tasks.
If you want to test your system’s actual thermal ceiling deliberately, a stress-testing tool like Prime95 pushes your CPU to 100% utilization on every core simultaneously. This is useful for confirming your cooling setup has headroom before you trust it with a long render or compile job, but it’s an intentional stress test, not something to leave running casually, since it generates more heat than typical daily use ever will.
Tip: Only perform stress tests if the environment is well-ventilated, and never leave your system unattended.
What’s a Normal CPU Temperature?
A normal CPU temperature depends entirely on what your CPU is doing at that moment, whether it’s idle, light use, gaming, or sustained heavy load all have different expected ranges. Judging a single number like “75°C” without that context is the single most common mistake people make when checking CPU temp.
| Use Case | Normal Range | Notes |
| Idle (desktop, no active tasks) | 30–50°C | Should stabilize within a minute or two of no activity |
| Light load (browsing, video, office work) | 40–60°C | Brief spikes are normal |
| Gaming / heavy load | 65–85°C | Sustained is fine within this band |
| Warning zone | 90°C+ | Investigate cooling if sustained |
| TjMax / maximum (chip-dependent) | ~95–105°C | The hard ceiling before throttling or shutdown |
What to Do If Your CPU Temperature Is Too High
If your CPU is consistently running above the 85–90°C range under load or hitting 90°C+ at idle, follow these steps:
1. Improve Cooling
- Confirm your CPU cooler is properly seated and making full contact with the chip.
- Check that your cooler is actually rated for your CPU’s thermal design power (TDP), a cooler carried over from an older, lower-power build is often undersized for a new chip.
- If your thermal paste is more than 2–3 years old, it has likely degraded and lost much of its heat-transfer efficiency, so reapply fresh thermal paste between the CPU and cooler.
- Include dust removal and fan inspection as part of routine PC maintenance, especially if the computer operates in a dusty environment or runs for long periods every day.
2. Optimise Airflow
- Clean dust off your heatsink fins, intake filters, and fan blades with a can of compressed air every few months.
- Confirm your case fans follow a sensible airflow path: cool air in from the front or bottom, warm air out through the rear or top.
- Tidy up basic cable management inside the case that may have obstructed airflow.
3. Reduce Workload
- Open Task Manager’s Processes tab and check for anything unexpectedly consuming CPU cycles.
- Close unnecessary background applications, browser tabs, and startup programs to reduce sustained load.
- Watch for signs of malwares, a hidden process or malware can push temperatures up even when you’re not doing anything demanding.
4. Software & Firmware Updates
- Keep BIOS up-to-date and also update drivers frequently.
- Make sure Windows has the current chipset and CPU driver packages installed.
- Outdated firmware can cause inefficient power delivery or incorrect fan-curve behavior.
5. Consider Undervolting and Power Limit Adjustments
- Undervolting reduces the voltage your CPU draws for a given clock speed, cutting heat without necessarily cutting performance. Use Intel XTU (Extreme Tuning Utility) if you have an Intel chip, or AMD Ryzen Master if you have an AMD chip.
- Start conservatively and test stability thoroughly after every change, don’t make large adjustments at once.
- Results vary chip to chip; not every CPU has the same undervolting headroom, so treat this as trial-and-error within safe limits.
6. Laptop-Specific Tips
- Use a hard, flat surface rather than a bed or couch cushion, soft surfaces block intake vents from underneath.
- Consider a cooling pad with its own fans for sustained gaming or rendering sessions.
- Check internal vents periodically for dust or pet hair. Laptop intakes clog faster than desktop cases due to how close components sit to the exterior.
Conclusion
Checking your CPU temperature takes two minutes with free software and tells you more about your system’s health than almost any other single metric. Most high-temperature problems trace back to something simple; dust, aging thermal paste, or a background process and are fixable without buying new hardware. Meanwhile, by checking your CPU temperature regularly, you can reduce the risk of system crashes, extend your hardware’s lifespan, and keep your computer running efficiently.
Is your CPU overheating or running warmer than it should? Computer Mechanics in Perth provides quick laptop and computer repair services. We can diagnose the cause, clean your cooling system, replace thermal paste, or repair faulty fans and hardware. Our fast, expert service helps restore safe CPU temperatures and keeps your computer performing at its best.
FAQs
1. How to monitor CPU temperature?
To monitor CPU temperature on Windows, use a free tool like Core Temp or HWiNFO, since Task Manager doesn’t display it. A normal CPU temperature is 30–50°C at idle and 65–85°C under gaming or heavy load; sustained readings above 90°C typically indicate a cooling problem. On Mac, tools like iStat Menus provide the same live readings, and BIOS/UEFI offers a software-free idle-temperature check on any system.
2. How do I check CPU temp on a laptop?
The same monitoring tools work identically on a laptop as on a desktop. The one difference is context: expect idle and load temperatures to run several degrees higher than an equivalent desktop, since laptop cooling systems have far less physical space to dissipate heat.
3. How often should I monitor CPU temperature?
For most everyday users, checking every few months or any time you notice slowdowns, unusual fan noise, or unexpected shutdowns is enough. Gamers, content creators, and anyone running sustained heavy workloads benefit from keeping a lightweight tool like Core Temp or HWiNFO running in the background during demanding sessions.
4. What’s the difference between CPU and GPU safe temps?
CPUs and GPUs have broadly similar safe ranges, both generally idle in the 30–50°C range and run 65–85°C under sustained load, but they’ve different TjMax ceilings depending on the specific chip. A gaming GPU running hotter than an idling CPU during the same session is normal, since GPUs are frequently engineered to operate comfortably closer to their thermal ceiling than CPUs are.
5. Why is my CPU running hot?
The most common causes that your CPU is running hot are dust restricting airflow around the heatsink and fans, thermal paste that has degraded after a few years of use, a cooler that’s undersized for the CPU’s actual heat output, or unexpected background CPU usage from an application or, less commonly, malware. Checking these in that order resolves the majority of unexplained high-temperature cases without requiring new hardware.
5. How do I lower CPU temperature?
Start with the free fixes: clear dust from fans and heatsink fins, confirm your case airflow follows a clear intake-to-exhaust path, and close unnecessary background processes. If temperatures are still high after that, reapplying thermal paste is usually the next highest-impact step, followed by a properly rated cooler upgrade or, for more advanced users, undervolting through a tool like Intel XTU or AMD Ryzen Master.
